C4, Diagrams as Code & Architectural Joy


This is a long form article showing the journey of how we gained value in using C4 diagrams combined with Diagrams as Code when representing our team's architecture. I wanted to go into detail about where we were coming from and the issues we saw in that approach, along with each piece of the puzzle that formed a better approach.
A note of thanks here to Simon Brown who has released all diagrams on his C4 Model website under a Creative Commons Attribution 4.0 International Licence.
Where We Were
Let's imagine a scenario (one I've been on both sides of the table for multiple times!): you start a new job at a large, relatively mature company; one that uses things like microservices, events and loosely coupled components.
On your first week your Engineering Manager books a meeting to give you a high level overview of their team's architecture. Grinning with pride they bring up the following view using Diagrams.Net:
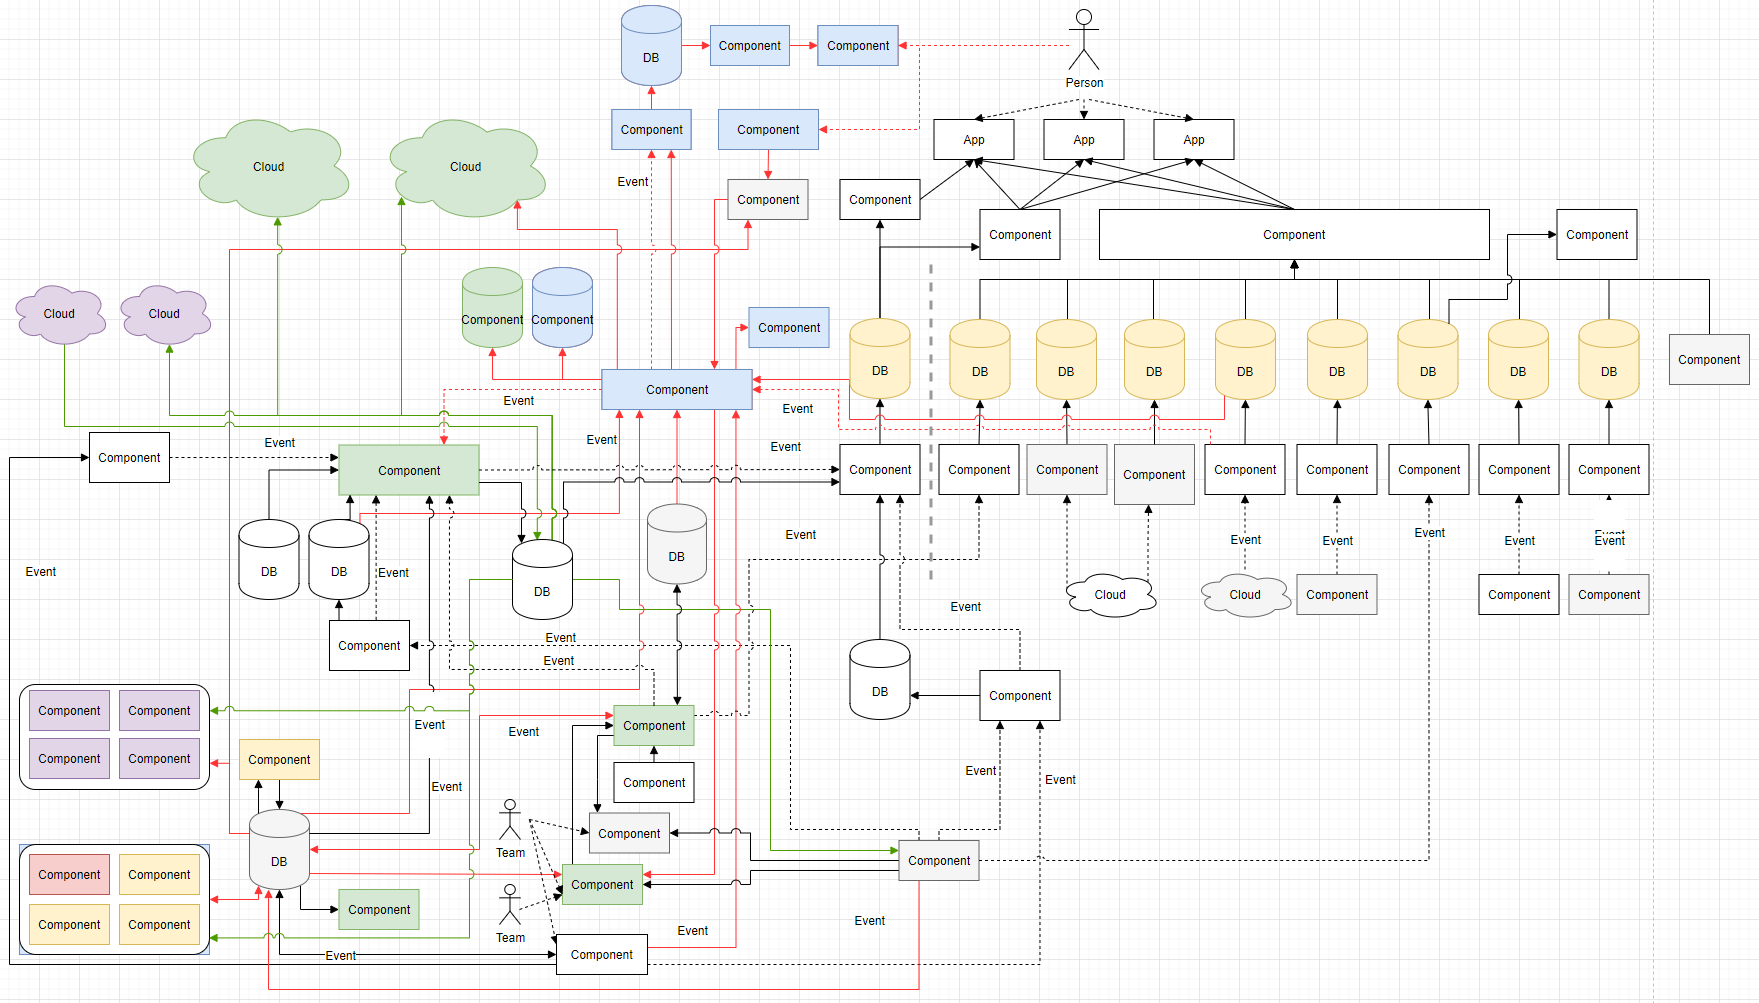
To the Engineering Manager and existing team; this is a thing of beauty, they understand it, have internalised the structure & use it for discussions on their architectural direction.
To focus on the positive first; in this scenario the team is prudent at keeping the diagram up to date, have laid it out in a top to bottom way that, once understood, can be navigated well & have used colour as a key to denote the state of components listed.
However as that engineer that has just joined the team, this diagram is daunting, scary even. It would require study, multiple questions, and long discussions on the context that the diagram leaves out. It is also only a subset of a wider system; where does it sit in relation to other components in our company? What would it look like if we attempted to diagram the whole organisation's architecture like this? (a mess most likely!)
I've seen this and diagrams like it presented during meetings, with the expectation being that it will aid understanding, however often when they reach this level of complexity the first 10-15 minutes is an attempt by participants to understand what they are looking at.
This format of diagram (specifically stored as a file using tools like Diagrams.Net) also then leads to other impracticalities:
- Where do you store the diagrams in a way that makes them discoverable to others?
- How do you version the diagrams, showing the differences over time as the architecture evolves?
- How do you search for references to components across diagrams? Say if I wanted to change one of the components, how do I find diagrams relating to it to understand more about the wider context it sits in?
- How do we, as a wider organisation, standardise the format, to help other engineers quickly understand what they are viewing?
- How do we reduce duplication, so that there aren't multiple variants of the same diagram at different levels of correctness floating around the company?
Isn't There A Better Way?
At the start of 2020 I was introduced to the concept of C4 Diagrams by Ian Cooper as a way of representing system architecture.
The C4 Model changes the approach to diagrams by proposing we should be representing architecture using 4 different zoom levels, similar to how in a map you may have a zoomed out, less detailed wider view of the system, then at each zoom level you see more detail.
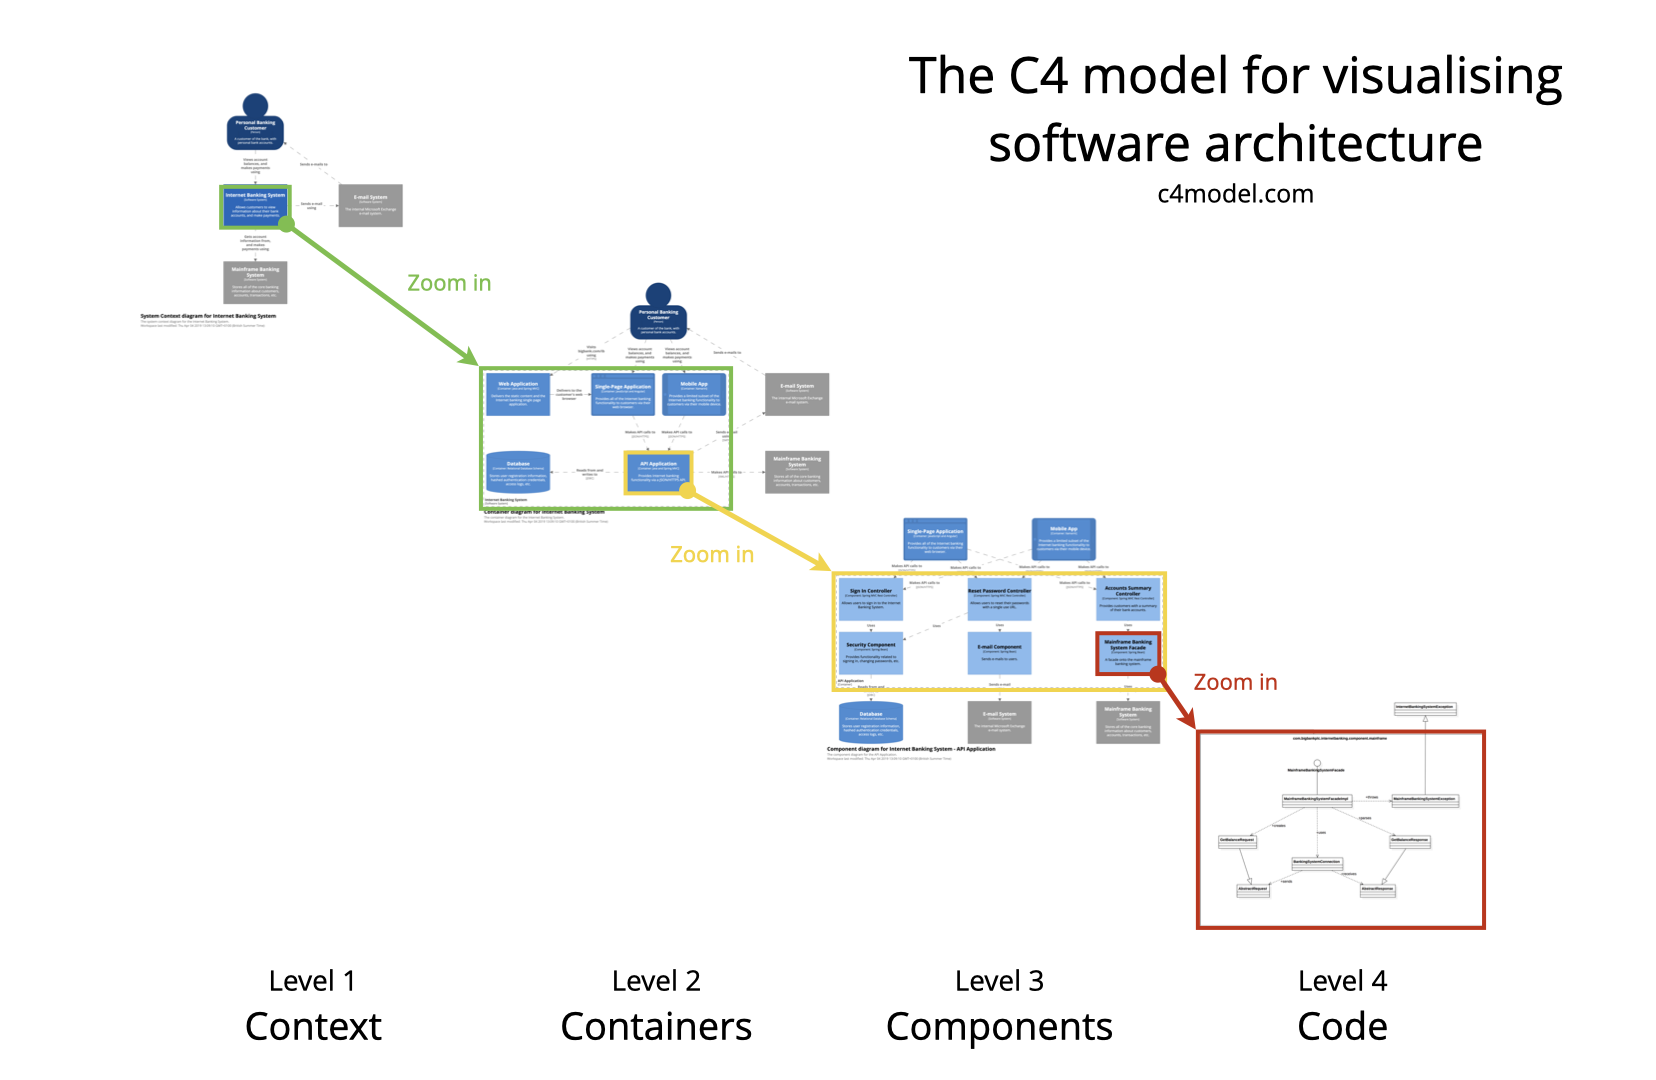
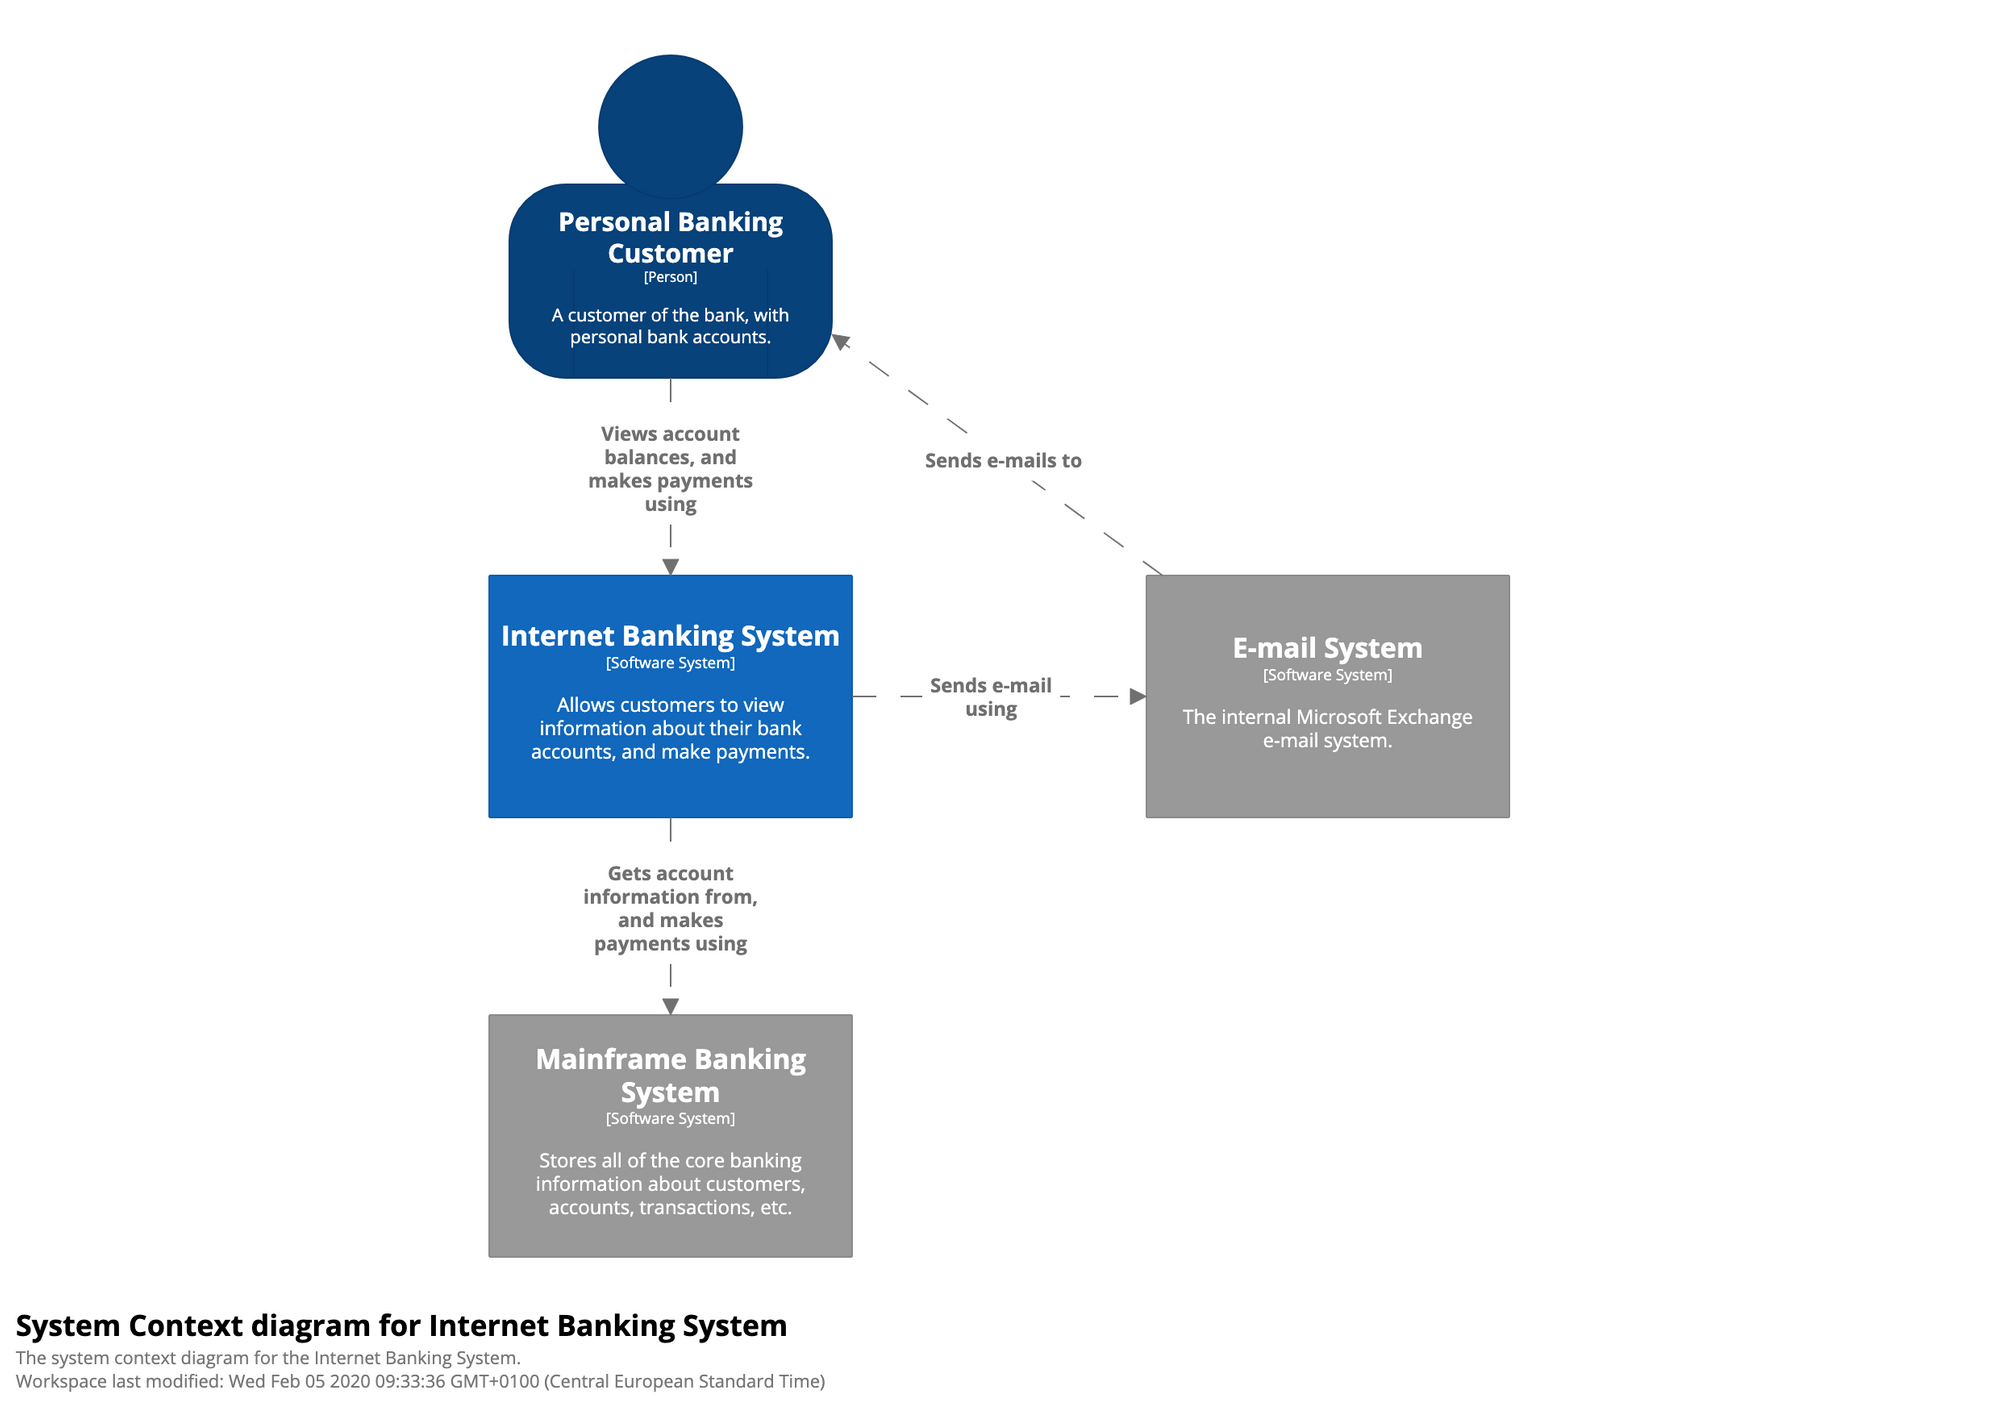
The highest level is the System Context view seen below, this doesn't show individual components but instead abstracts which systems talk to one another and the people that interact with them. Back to our original new starter scenario, this is the diagram you would start with to explain the context of your team and where it sits in the wider company.
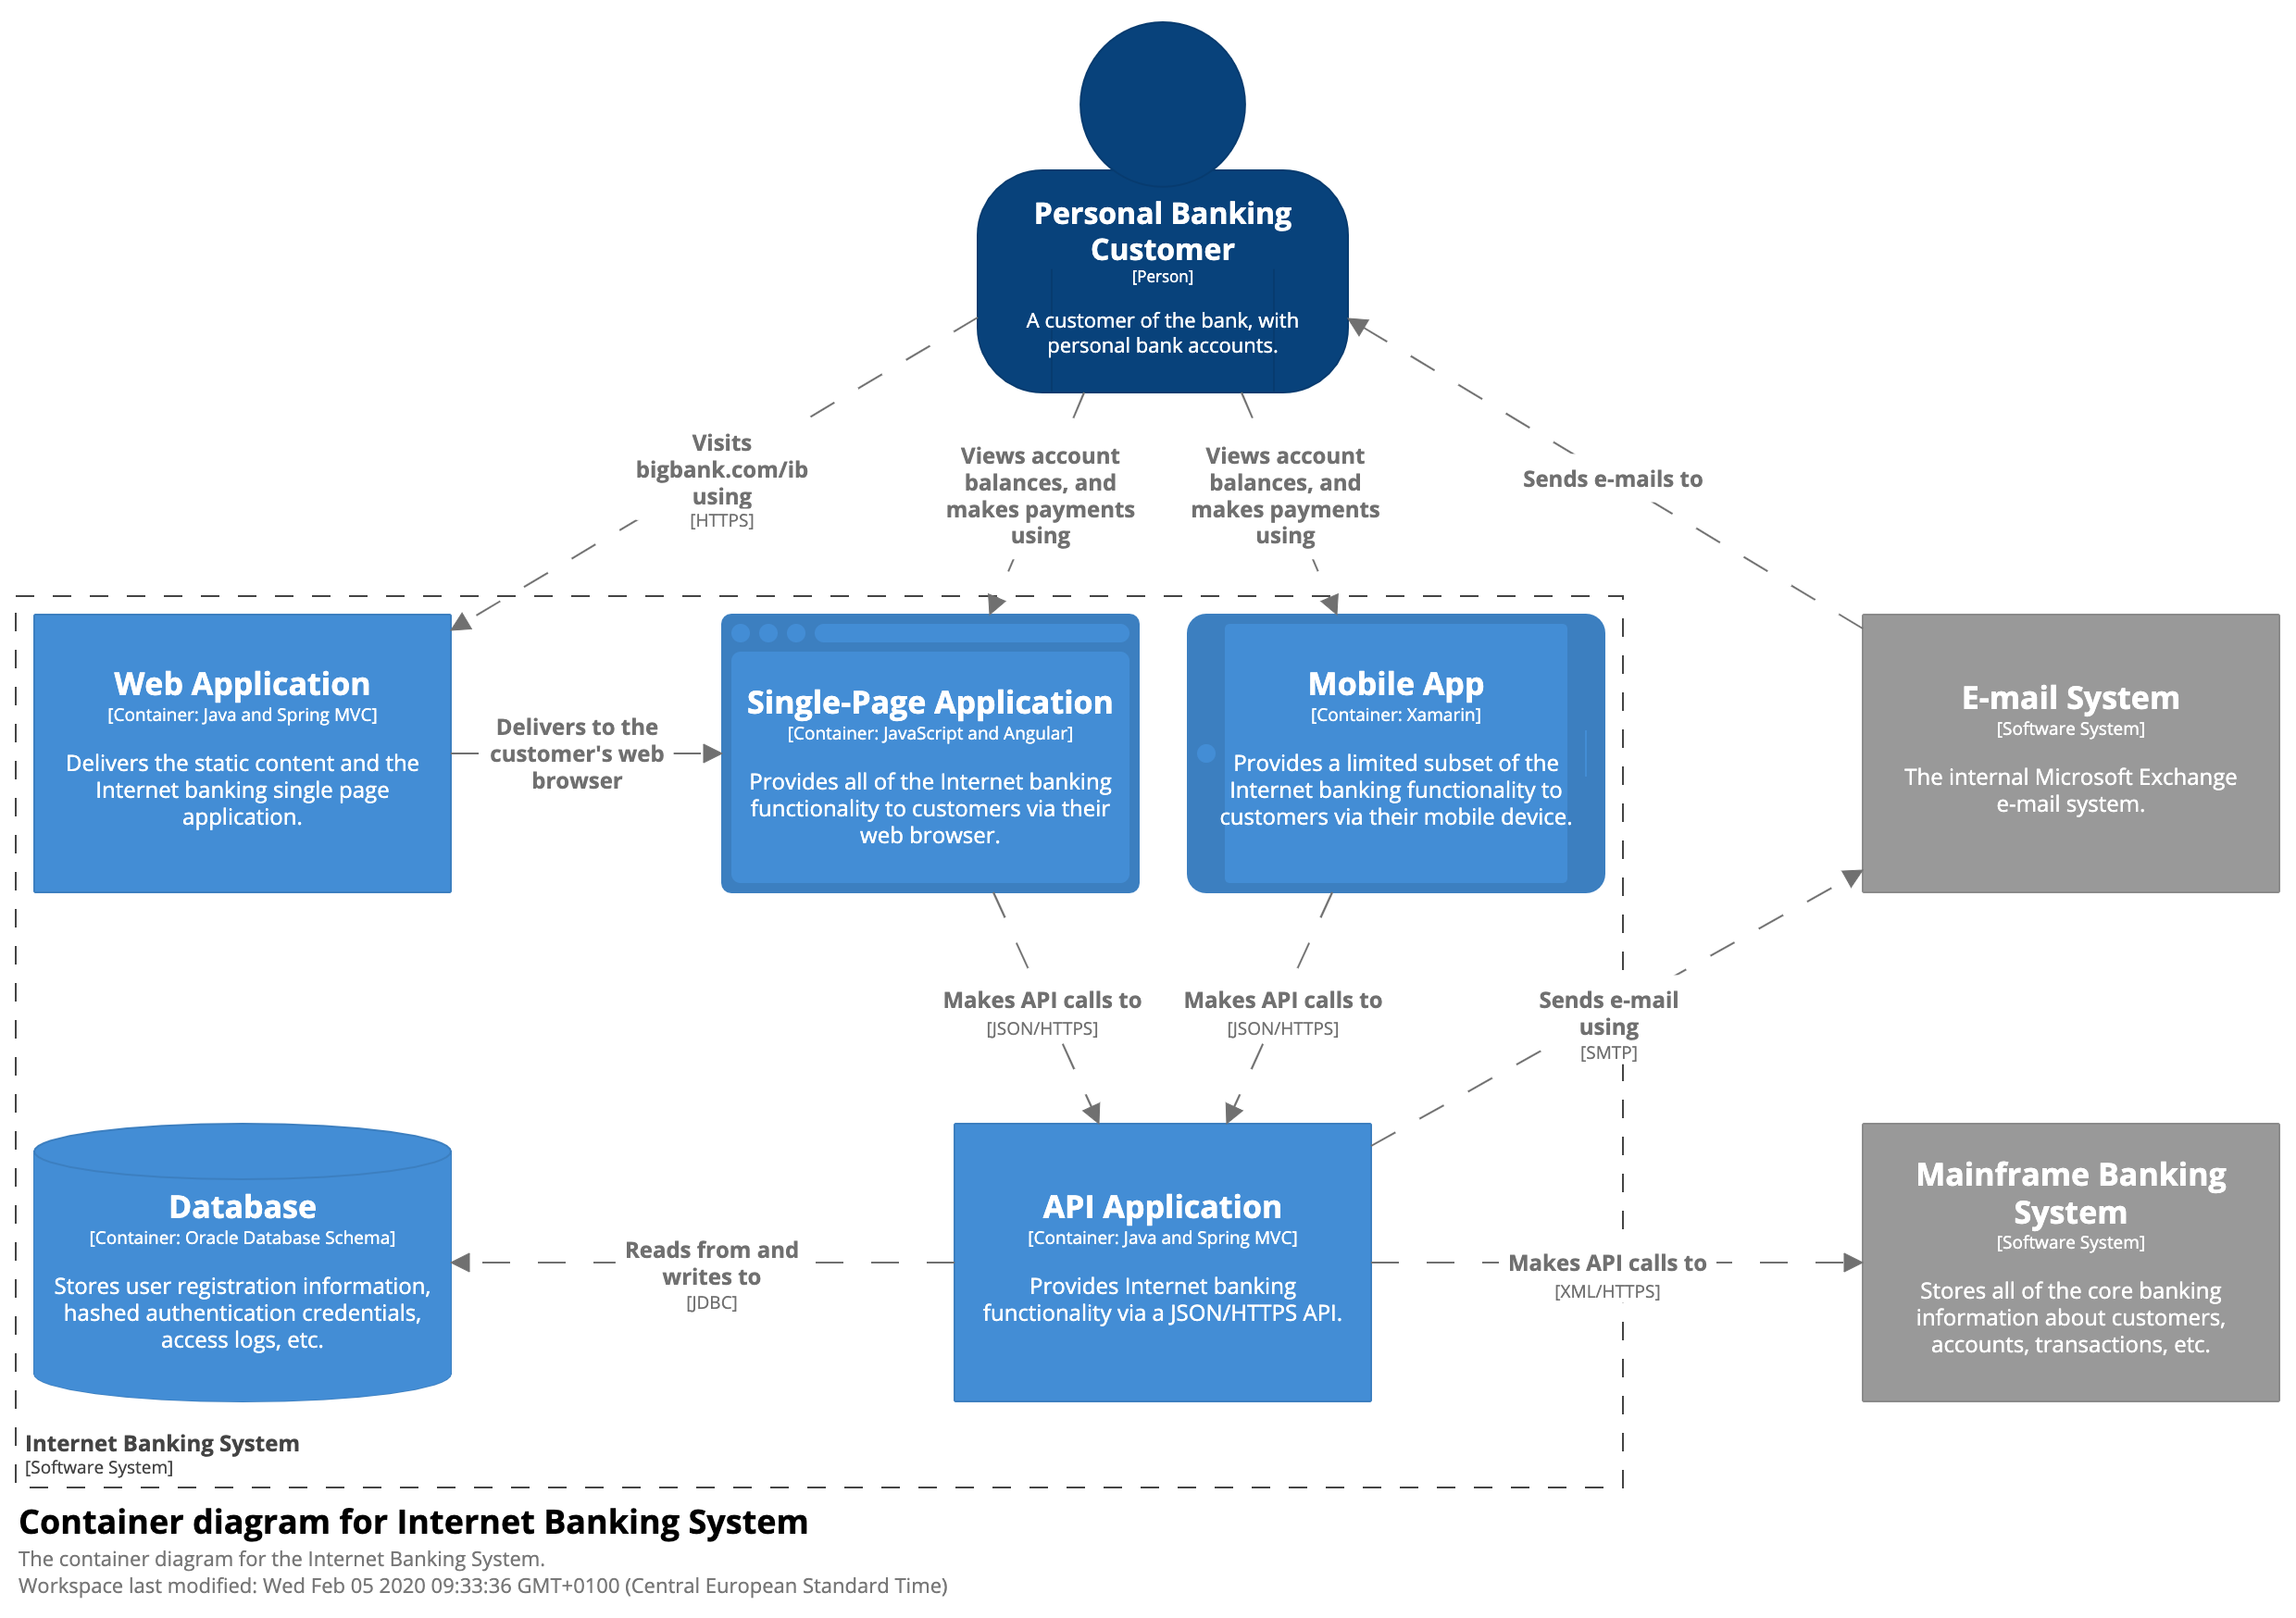
The next level is the Container view; which takes one of the above systems and zooms into it (in this example it zooms into the blue Internet Banking System) whilst leaving the greyed out systems abstracted.
This here is the genius of the approach, by limiting the detail you go into so it's focused on a singular part of the wider system, it helps reduce the complexity whilst still showing in what context you are working. You could then have multiple Container views, one for the Internet Banking System, one for the Email System and one for the Mainframe Banking System.
The Container view abstracts at component level, showing the features that make up the system without going into detail about the internals of that feature.
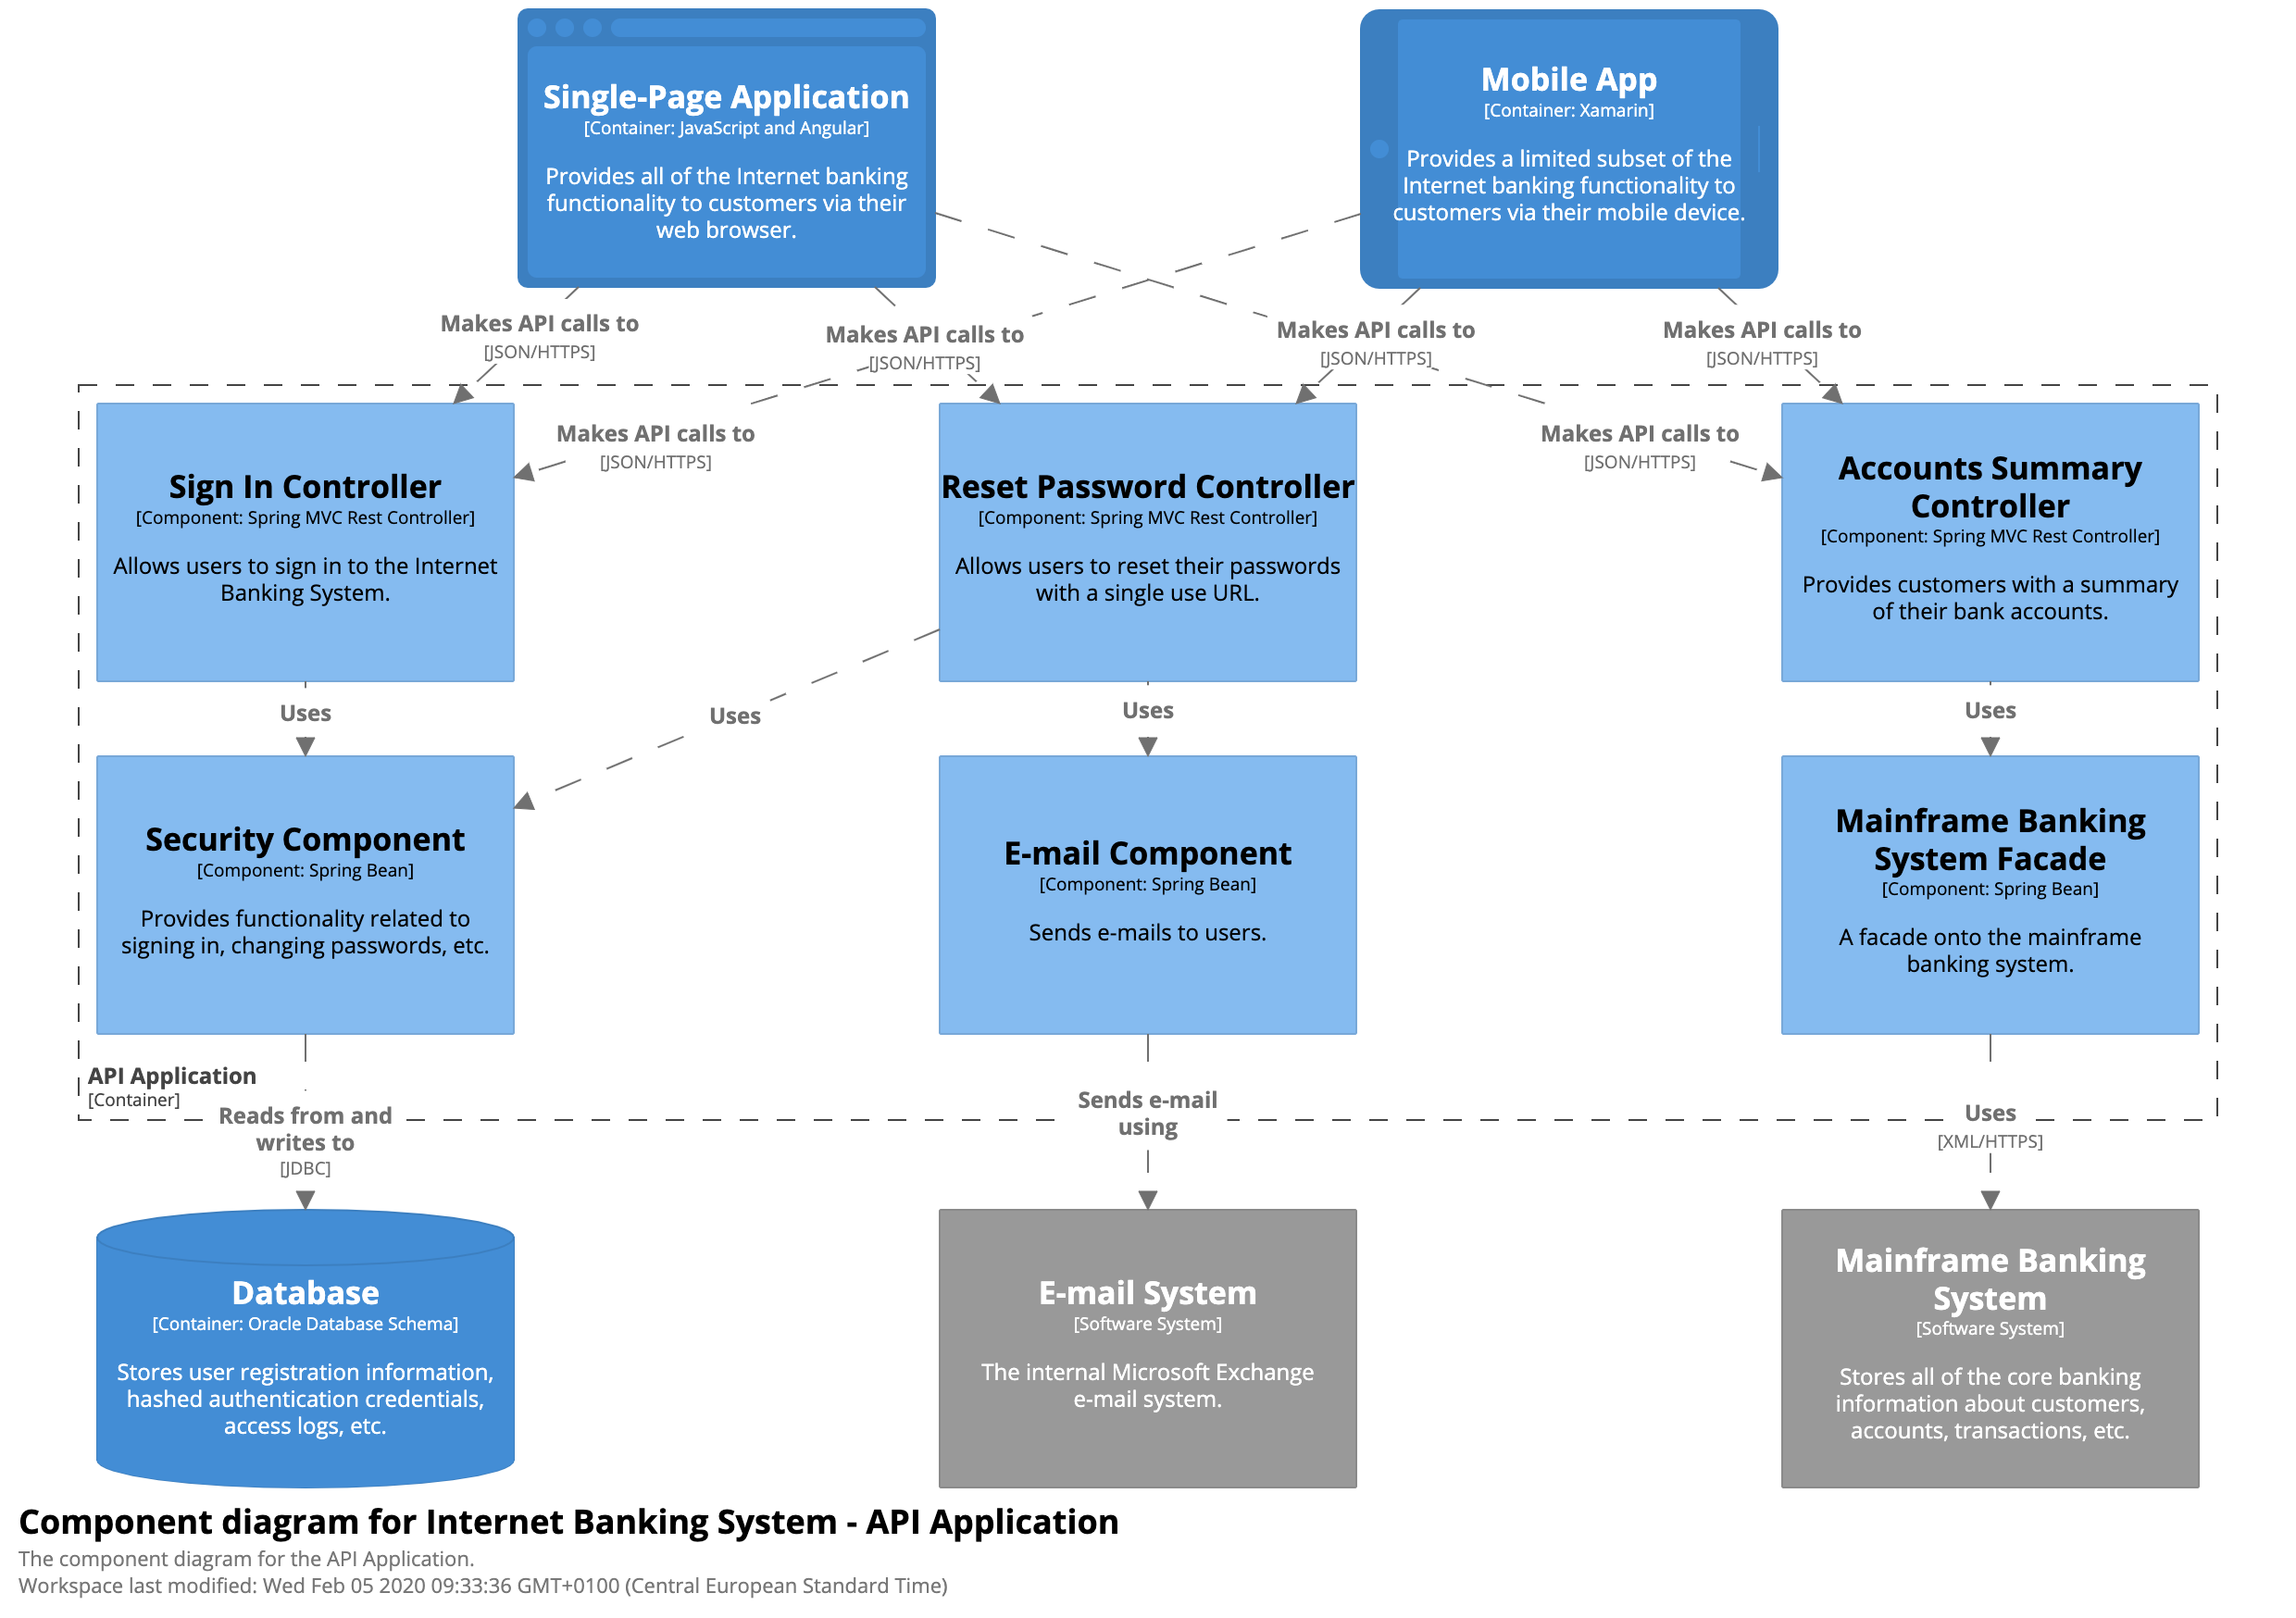
Next we have the Component view that zooms into one of the highlighted components, in this example the API Application. This view shows us the prominent internals of a component whilst also showing it's wider context in the system are zoomed into.
Finally we have the Code view; which is akin to a class diagram from UML. This is the lowest level of zoom and one where we get less usage out of, the recommendation is you stop at the Component view to get the most value.
Simon has a great talk explaining this further which I've embedded below.
This Solves One Problem, What About The Others?
So if we adopt C4 we solve what I see as the most prominent issue; building architectural diagrams that help understanding the system and context without being overly complex or detailed.
However by producing C4 models in the same tooling we use to make other diagrams we still have the problems of discoverability, standardisation, versioning and duplication.
Enter PlantUML, Visual Studio Code & C4 Templates
PlantUML is a open source piece of diagramming software that allows you to write diagrams as code.
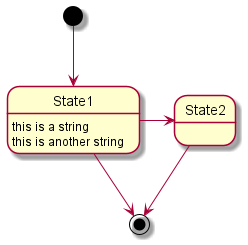
For example; I can write this script:
@startuml

[*] --> State1
State1 --> [*]
State1 : this is a string
State1 : this is another string

State1 -> State2
State2 --> [*]

@enduml
Which produces this diagram:
Right off the bat; the ability to write diagrams as code starts to be a game changer. Now we can start storing diagrams in our git repositories, making changes to them plain text, versioned and part of any PR review process we have. We can set up a server hosting the PlantUML renderer to take whatever is currently in master for a features docs and render that image, rather than storing static images of diagrams.
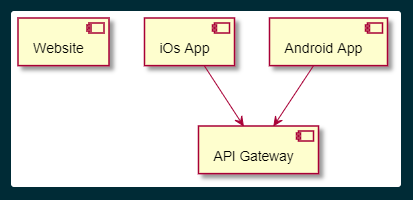
An additional feature with PlantUML that helps with deduplication and standardisation is the ability to import other plantuml format files into a diagram. For example I can create this base file containing 3 components
@startuml BaseSystem

[Website]
[iOs App]
[Android App]

@enduml
Then import it into another file:
@startuml Derived

!include BaseSystem.puml

[API Gateway]

[iOs App] -->  [API Gateway]
[Android App] --> [API Gateway]

@enduml
To create this:
However where PlantUML goes from "that's cool" to "that's downright essential" is in the next two bits of tooling.
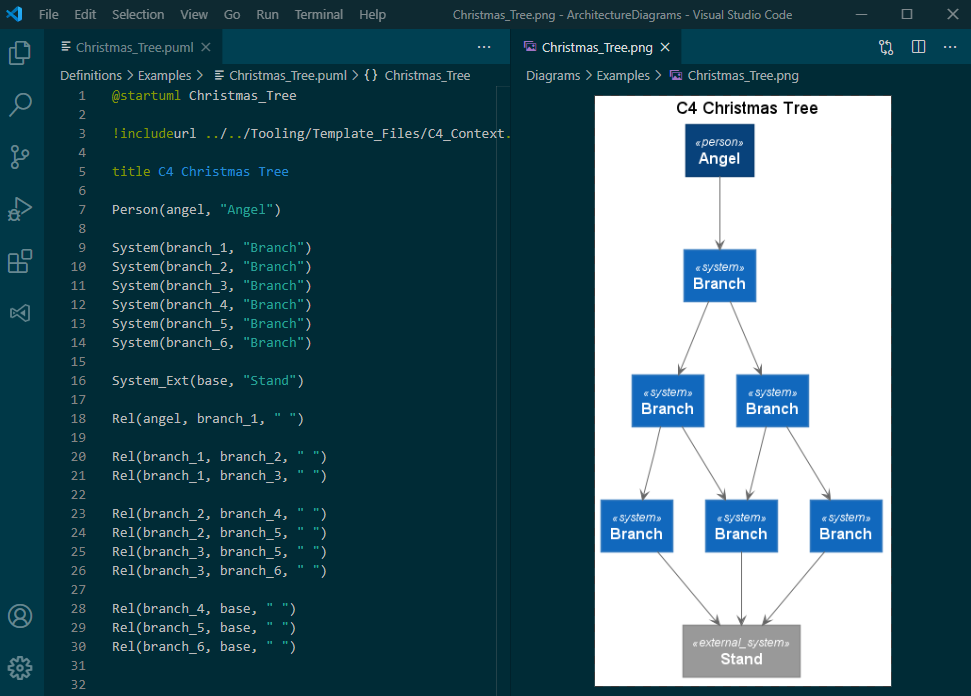
Firstly; there is a Visual Studio Code plugin that allows you to write diagrams and render them right in your IDE, making it easier to create diagrams as part of your source code:
Secondly; there are C4 Templates available on GitHub that allow you to generate C4 diagrams in a standardised format using PlantUML.
So you can write this script:
@startuml C4_Elements
!include https://raw.githubusercontent.com/plantuml-stdlib/C4-PlantUML/master/C4_Container.puml

Person(personAlias, "Label", "Optional Description")
Container(containerAlias, "Label", "Technology", "Optional Description")
System(systemAlias, "Label", "Optional Description")

Rel(personAlias, containerAlias, "Label", "Optional Technology")
@enduml
To generate this image:
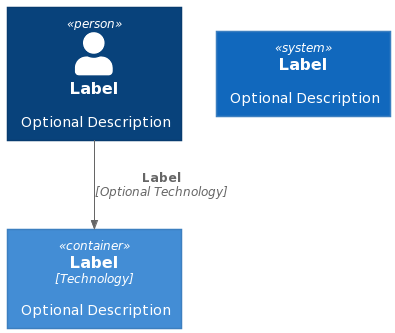
To recap then; with these 3 tools we can write diagrams as source code, in a standardised C4 format, with a focus on limiting complexity & providing wider context.
Where We Are Now
Adopting this as a team we now have diagrams for our components stored within the git repos in plantuml format, using C4 to generate a set of System, Container and Component diagrams for our features that provide greater detail without overcomplicating things.
Going back to our original problem set:
Where do you store the diagrams in a way that makes them discoverable to others?
They are now stored in source code, alongside the component, if you want to find the diagrams that relate to a component you navigate to it in GitHub.
How do you version the diagrams, showing the differences over time as the architecture evolves?
As they are stored in source code we can see differences over time and include changes in our PR review process.
How do you search for references to components across diagrams? Say if I wanted to change one of the components, how do I find diagrams relating to it to understand more about the wider context it sits in?
Simple as a GitHub search, all diagrams are stored in plain text.
How do we, as a wider organisation, standardise the format, to help other engineers quickly understand what they are viewing?
Using PlantUML, C4 Templates & the C4 Model our diagrams are standardised in format and layout.
How do we reduce duplication, so that there aren't multiple variants of the same diagram at different levels of correctness floating around the company?
As a company we can move towards having a base repository of diagrams that can be inherited from and shared. This one still needs fleshing out however the tooling is there and supports it.
Further Reading
 Simon Brown